Strain Phylogenetics
RotTrees
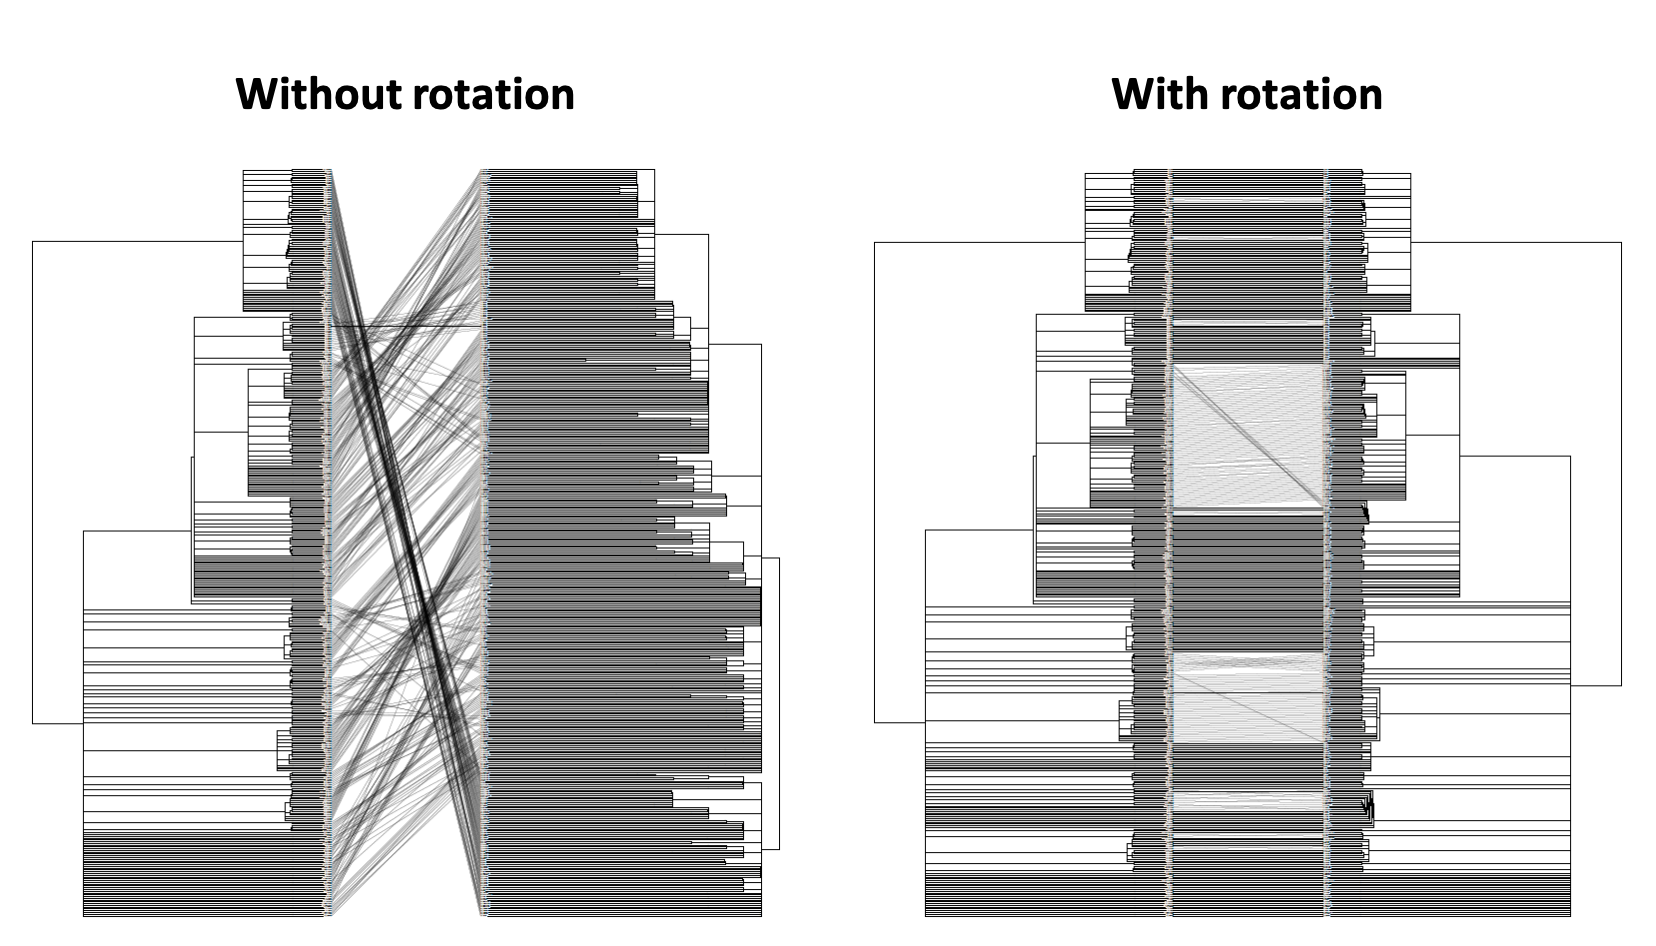
RotTrees enables quick inference of congruence of tanglegrams. This is particularly useful for SARS-CoV-2 phylogenomics due to multiple groups independently analyzing data-sets with many identical samples. Previous tanglegram visualization software, such as cophylo and Dendroscope3 rely on fewer rotations to minimize crossings over, which is inadequate for phylogenies on the scale of SARS-CoV-2. We implemented a quick heuristic to produce vastly improved tanglegrams.
First, ensure that tree_1.nh and tree_2.nh have identical sets of samples. Then, use as follows:
./build/rotate_trees --T1 tree_1.nh --T2 tree_2.nh --T1_out rot-tree_1.nh --T2_out rot-tree_2.nh
The above command produces rotated trees (rot-tree_1.nh and rot-tree_2.nh) with a much improved tanglegram as seen below (images generated with the help of cophylo, setting rotate to FALSE).
Below is a GIF of approximately 20 frames showing various operations of the tree rotation algorithm operating on a much larger pair of trees (~4k leaves)
Options
--T1: Input tree 1 (in Newick format).
--T2: Input tree 2 (in Newick format).
--T1_out: Output tree 1 (in Newick format).
--T2_out: Output tree 2 (in Newick format).
--max_iter: Maximum number of iterations. Default = 100
--help: Print help messages.
TreeMerge
python3 scripts/tree_merge.py -T1 tree_1.nh -T2 tree_2.nh -symmetric 1 -T_out symm-merged-tree_1-tree_2.nh
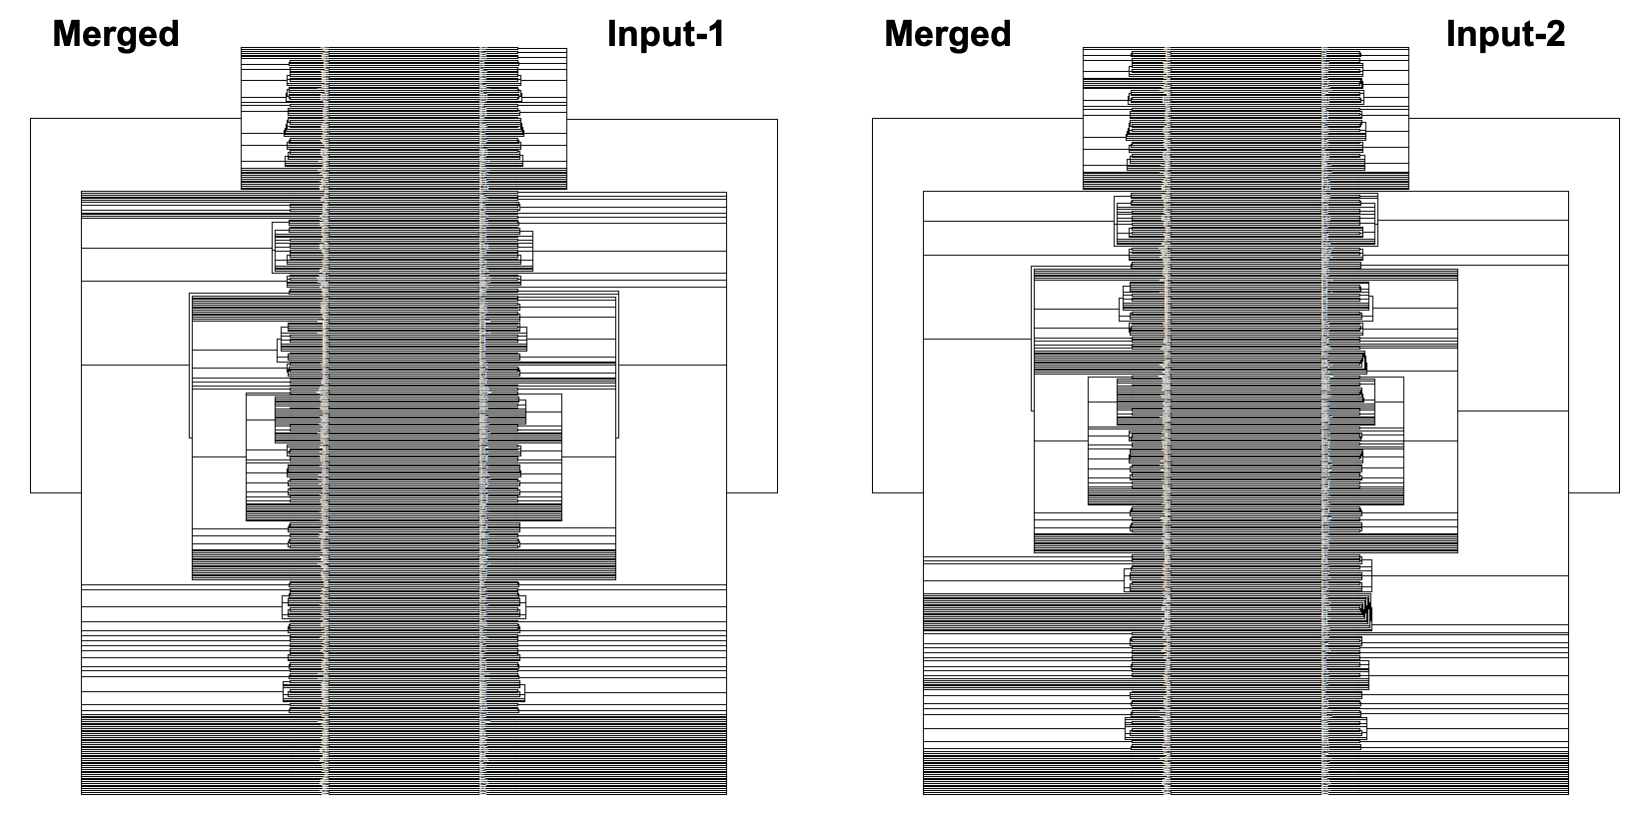
The above command produces a merged tree (symm-merged-tree_1-tree_2.nh) from two input trees (tree_1.nh and tree_2.nh) that is maximally resolved and compatible with both input trees (refer to our manuscript for more details). Below are the resulting tanglegrams of the resulting merged tree with the two input trees (after applying tree rotation). The above command can also be used without the symmetric flag for its asymmetric version (where the first input tree is given a priority to resolve the merged tree) or using the intersectOnly flag that produces a simple consensus of the two input trees.
Options
-T1: tree 1 (in Newick format). (REQUIRED)
-T2: tree 2 (in Newick format). (REQUIRED)
-T-out: output tree filename (in Newick format). (REQUIRED)
-intersectOnly: output intersection (instead of a maximal merge) of T1 and T2.
-symmetric: output symmetric merge of T1 and T2.
--help (-h): Print help messages.
Find parsimonious assignments
./build/find_parsimonious_assignments --tree tree/pruned-sumtree-for-cog.nh --vcf vcf/tree_1.vcf > tree_1_PARSIMONY.txt
The above command reads the tree topology of the input Newick file and assigns an internal numeric label for each internal node (ignoring the internal labels and branch lengths if already provided by the input Newick). The first two lines of the output file print the input tree with internal nodes labelled in Newick format. The output is too large to display, so we view the first 1000 characters using the command below.
head -c 1000 tree_1_PARSIMONY.txt
For each variant/site in the VCF file, the output file then displays the allele frequency for each alternate variant, its total parsimony score, the list of nodes (comma-separated, if its length is <=4) for which the branches leading to it have acquired a mutation (forward [F] or backward [B], the sizes of the clades affected by those mutations and a list of flagged leaves which are affected by a mutation affecting 3 or fewer leaves.
Options
--tree: Input tree file.
--vcf: Input VCF file (in uncompressed or gzip-compressed format).
--threads: Number of threads. Default = 40
--print-vcf: Print VCF with variants resolved instead of printing a parsimony file.
--help: Print help messages.
Identify extremal sites
python3 scripts/identify_extremal_sites.py -in tree_1_PARSIMONY.txt
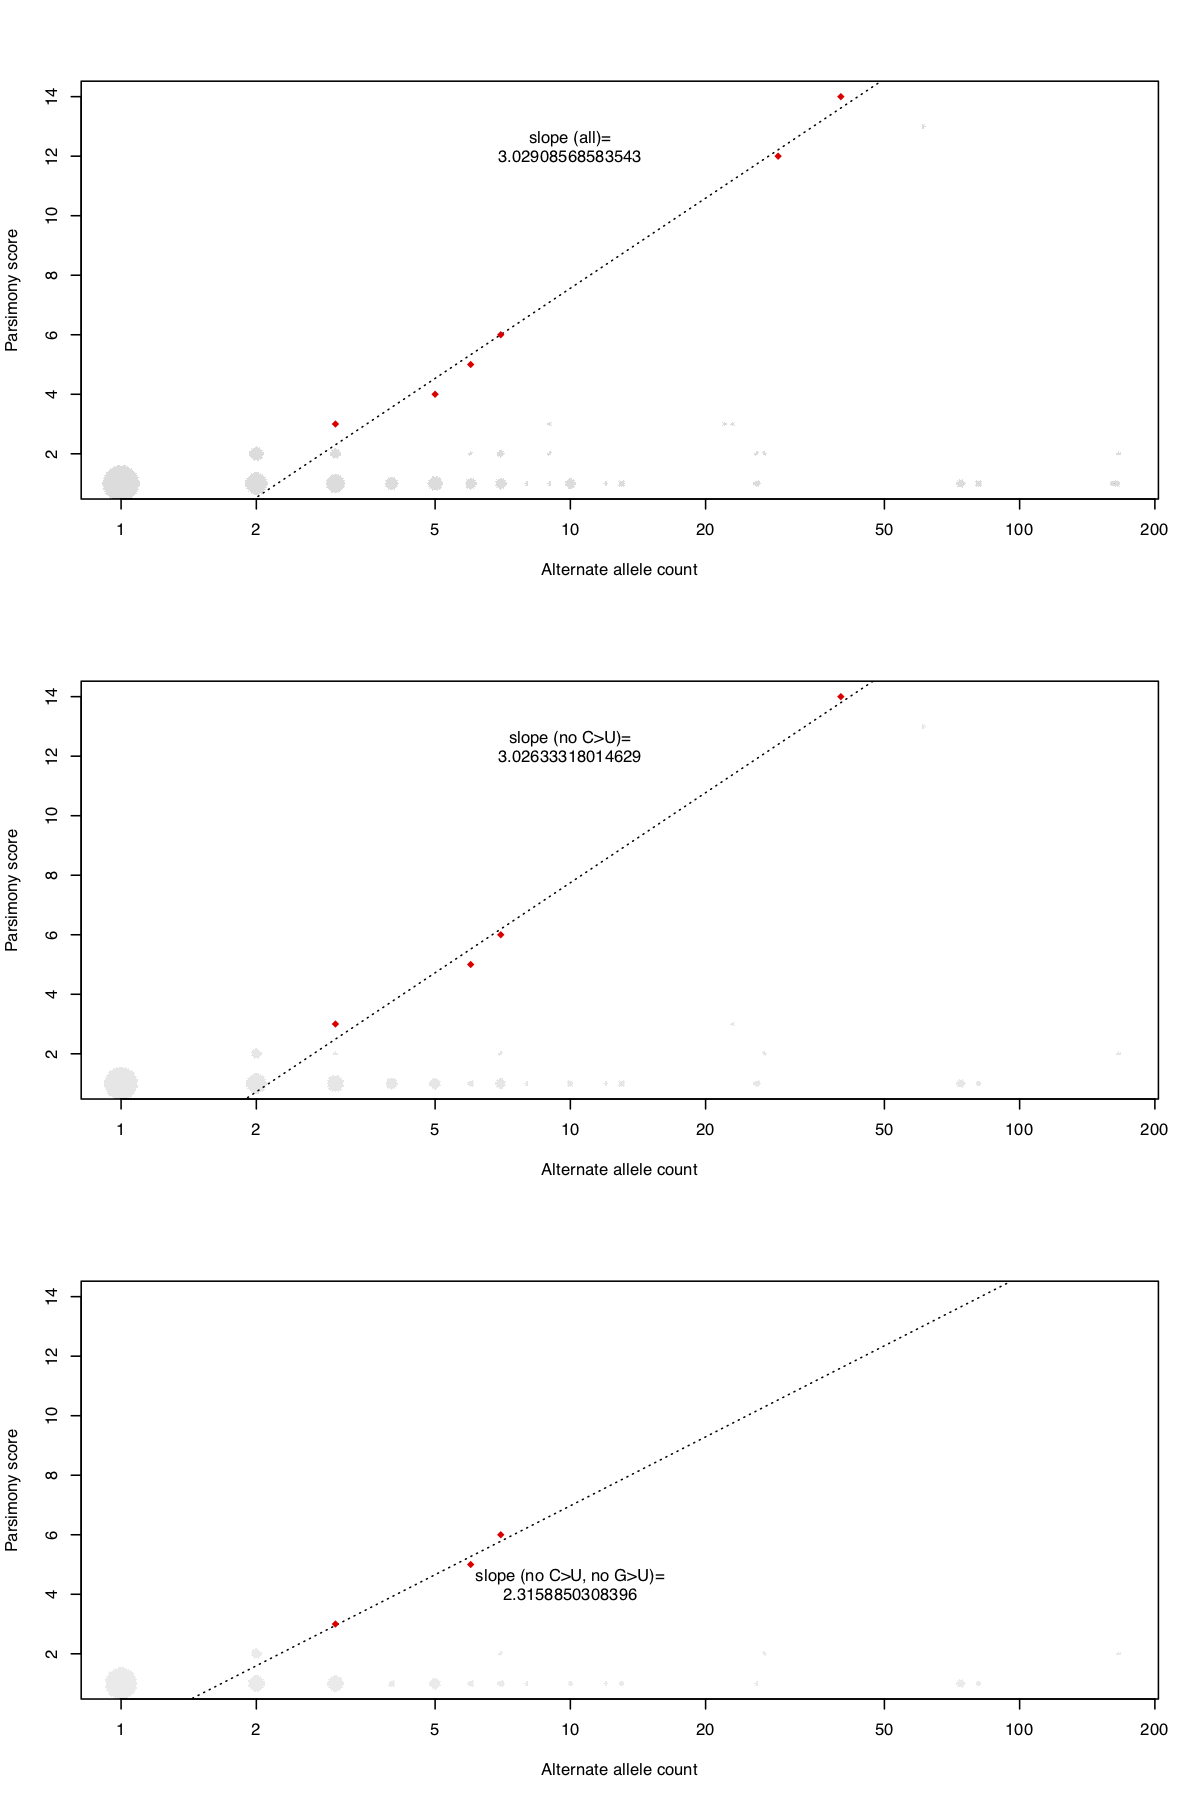
The above command can be used for identifying and flagging extremal sites i.e. sites having exceptional parsimony scores relative to their allele frequencies and therefore also suspected to contain systematic errors. The above command identifies 6 extremal sites (C11074T, C27046T, T13402G, A3778G, G24390C, G26144T) with a phylogenetic instability value of 3.03. For the precise definition of extremal sites and phylogenetic instability, refer to our manuscript referenced at the bottom. The code also provides an ability to ignore high-frequency C>T and G>T mutations using optional flags.
python3 scripts/identify_extremal_sites.py -in tree_1_PARSIMONY.txt -ignoreCtoT=1 -ignoreGtoT=1
The above command identifies three extremal sites (T13402G, A3778G, G24390C) with a phylogenetic instability value of 2.32. To create a figure requires installing R and the plyr package.
Options
-in: Input parsimony file.
-ignoreCtoT: Set to 1 to ignore C>T sites (default=0)
-ignoreGtoT: Set to 1 to ignore G>T sites (default=0)
--help (-h): Print help messages.
Plot extremal sites
python3 scripts/generate_plot_extremal_sites_data.py -in tree_1_PARSIMONY.txt > plot_extremal_sites_data.txt
The above commands create raw input data for the extremal sites plot.
Rscript --vanilla scripts/plot_parsimony.r plot_extremal_sites_data.txt extremal_sites_plot.pdf
Next, the R command accepts the generated data and creates a log(allele count) by parsimony plot for all variant sites in a given vcf. It produces three plots, one of all data, one ignoring C>U mutations and one ignoring C>U and G>U mutations, as shown below.
Presentations
We have presented this package and analyses on GISAID data at the Covid-19 Dynamics & Evolution Meeting, held virtually on October 19-20, 2020. You can find our slides here.
Publications
Turakhia Y, De Maio N, Thornlow B, Gozashti L, Lanfear R, Walker C, Hinrichs A, Fernandes J, Borges R, Slodkowicz G, Weilguny L, Haussler D, Goldman N, and Corbett-Detig R. Stability of SARS-CoV-2 Phylogenies. PLOS Genetics. 2020. 16(11): e1009175.
De Maio N, Walker C, Turakhia Y, Lanfear R, Corbett-Detig R, and Goldman N. Mutation rates and selection on synonymous mutations in SARS-CoV-2. Genome Biology and Evolution. 2021.
DeMaio N, Walker C, Borges R, Weilguny L, Slodkowicz G, and Goldman N. Issues with SARS-CoV-2 sequencing data. Virological. 2020.
Gozashti L, Walker C, Goldman N, Corbett-Detig R, and DeMaio N. Updated analysis with data from 13th November 2020. Virological. 2020.